Shopping Cart
×
TOTAL
view cart
Continue Shopping
Check out
Skip to content
Just added to your cart
Qty:
View cart (
)
Continue shopping
Submit
Close search
(877) 800-9998
[email protected]
10% OFF YOUR FIRST PURCHASE ONLINE WHEN YOU SIGN UP FOR EMAIL*
0
items
Shopping Cart
×
Total
Check out
view cart
Continue Shopping
0
Login
Patek Philippe
DAVID YURMAN
WATCHES
By Popular Brands
Patek Philippe
Bell & Ross
Breitling
Bulova
Carl F. Bucherer
Cartier
Citizen
Frederique Constant
Hublot
IWC Schaffhausen
Jaeger Lecoultre
Michele
Movado
Omega
TAG Heuer
Tissot
Tudor
Victorinox Swiss Army
By Price
Under $1,000
$1,000 - $5,000
$5,000 - $10,000
$10,000 - $20,000
Over $20,000
Sale
Watches
Sell Your Watch
Pre-Owned
All Watches
JEWELRY
By Popular Brands
Avance Diamonds
Alex And Ani
Clara Williams
David Yurman
Engrace Diamonds
John Hardy
Lagos
Little Switzerland Diamonds
Marco Bicego
Nuri & Ash
Pandora
Roberto Coin
Swarovski
Zoë Chicco
By Price
Under $500
$500 - $1,000
$1,000 - $3,000
$3,000 - $5,000
Over $5,000
Sale
By Category
Rings
Necklaces
Pendants
Earrings
Bracelets
All Jewelry
Diamonds
Engrace Lab Created Diamonds
Engrace Bridal
Engrace Featured Items
Lab Created Diamond Jewelry
Lab Created Loose Diamonds
Diamond Jewelry
Virtual Try-On Engrace
Locations
All Locations
Aruba
Bahamas
Barbados
Dominican Republic
St. John
St. Thomas
Tortola
Shop Island Bangles
Search
Search
Search
0
Log in
Cart
0
items
Patek Philippe
DAVID YURMAN
WATCHES
WATCHES Menu
WATCHES
By Popular Brands
By Popular Brands Menu
By Popular Brands
Patek Philippe
Bell & Ross
Breitling
Bulova
Carl F. Bucherer
Cartier
Citizen
Frederique Constant
Hublot
IWC Schaffhausen
Jaeger Lecoultre
Michele
Movado
Omega
TAG Heuer
Tissot
Tudor
Victorinox Swiss Army
By Price
By Price Menu
By Price
Under $1,000
$1,000 - $5,000
$5,000 - $10,000
$10,000 - $20,000
Over $20,000
Sale
Watches
Watches Menu
Watches
Sell Your Watch
Pre-Owned
All Watches
JEWELRY
JEWELRY Menu
JEWELRY
By Popular Brands
By Popular Brands Menu
By Popular Brands
Avance Diamonds
Alex And Ani
Clara Williams
David Yurman
Engrace Diamonds
John Hardy
Lagos
Little Switzerland Diamonds
Marco Bicego
Nuri & Ash
Pandora
Roberto Coin
Swarovski
Zoë Chicco
By Price
By Price Menu
By Price
Under $500
$500 - $1,000
$1,000 - $3,000
$3,000 - $5,000
Over $5,000
Sale
By Category
By Category Menu
By Category
Rings
Necklaces
Pendants
Earrings
Bracelets
All Jewelry
Diamonds
Diamonds Menu
Diamonds
Engrace Lab Created Diamonds
Engrace Bridal
Engrace Featured Items
Lab Created Diamond Jewelry
Lab Created Loose Diamonds
Diamond Jewelry
Virtual Try-On Engrace
Locations
Locations Menu
Locations
All Locations
Aruba
Bahamas
Barbados
Dominican Republic
St. John
St. Thomas
Tortola
Shop Island Bangles
FASHION
Fashion
ALEX AND ANI
Initial V Charm Bangle
Regular price
$ 28
Sale price
$ 28
Regular price
Unit price
/
per
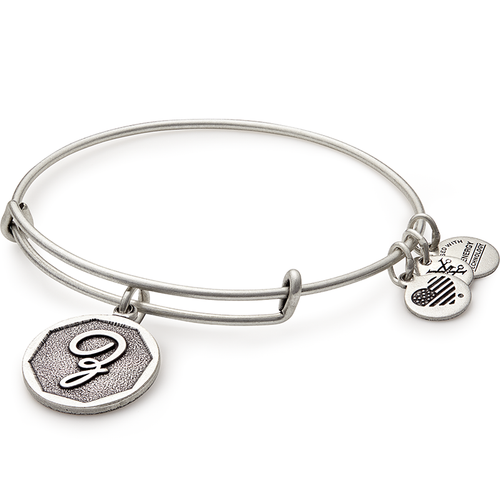
ALEX AND ANI
Initial Z Charm Bangle
Regular price
$ 28
Sale price
$ 28
Regular price
Unit price
/
per
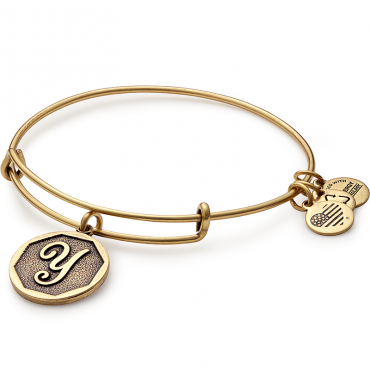
ALEX AND ANI
Initial Y Charm Bangle
Regular price
$ 28
Sale price
$ 28
Regular price
Unit price
/
per
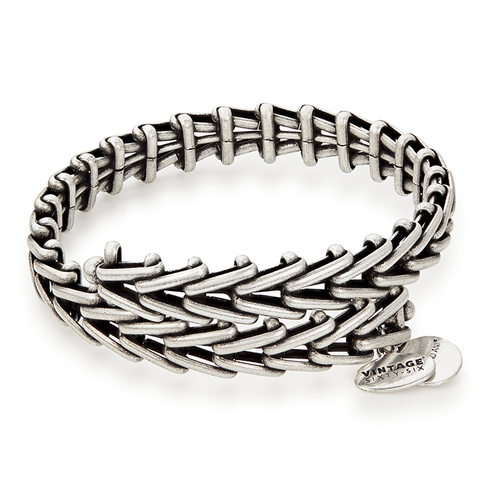
ALEX AND ANI
Gypsy 66 Wrap
Regular price
$ 58
Sale price
$ 58
Regular price
Unit price
/
per
ALEX AND ANI
Initial U Charm Bangle
Regular price
$ 28
Sale price
$ 28
Regular price
Unit price
/
per
ALEX AND ANI
Initial U Charm Bangle
Regular price
$ 28
Sale price
$ 28
Regular price
Unit price
/
per
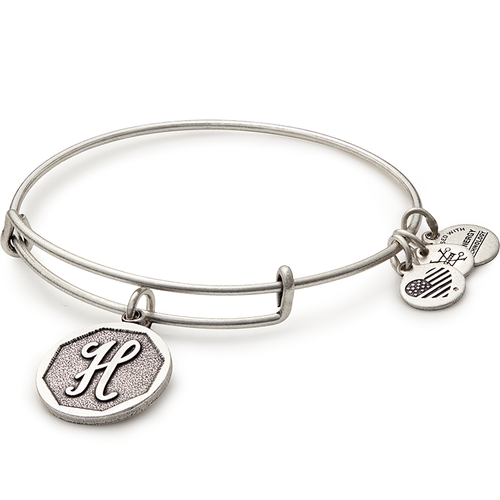
ALEX AND ANI
Initial H Charm Bangle
Regular price
$ 28
Sale price
$ 28
Regular price
Unit price
/
per
ALEX AND ANI
Initial F Charm Bangle
Regular price
$ 28
Sale price
$ 28
Regular price
Unit price
/
per
Previous page
Page 1 of 11
Next page
BE THE FIRST TO KNOW ABOUT NEW ARRIVALS AND PROMOTIONS
Use left/right arrows to navigate the slideshow or swipe left/right if using a mobile device
Choosing a selection results in a full page refresh.
Press the space key then arrow keys to make a selection.
MY WISH LIST
X
View wish list
Your wish list is empty.
X
X
X
WISH LIST AND COMPARE
Do you want to add products to your personal account?
YES
NO
Remove
0
0